Normal Describes a Population, Not You: Reading a Blood Test Beyond the Normal Range
Your blood test comes back. Every line reads "normal." The visit ends. But you still feel off, and nobody can say why. Here is the part nobody explains: "normal" is a statistic about other people, not a verdict about you. A reference range is built from a crowd, and you are one person. Reading a result the way it was actually built, that is the root-cause discipline Healz runs on.
This is not bad medicine. A busy clinician has to draw a line somewhere, and the reference range is a reasonable place to draw it. The trap is treating that line as biology instead of statistics.
Where the normal range actually comes from
A lab reference range is not a health target. It is a description of a population. Technicians measure a marker across a group of people presumed healthy, then take the central 95 percent of those values. The bottom 2.5 percent and the top 2.5 percent get cut off. Whatever is left becomes "normal."
Two consequences fall straight out of that math. First, by design, about 1 in 20 perfectly healthy people land outside the range on any given test, a false alarm baked into the method (a point spelled out in a peer-reviewed review in the Journal of the American Board of Family Medicine). Run twenty markers on a healthy person and one flagging is expected, not alarming. Second, some people who are genuinely unwell still test inside the range, because their number has not yet crossed a population line drawn around everyone else. The range sorts a crowd. It was never meant to diagnose you alone.
Ask Healz.
One chat instead of ten apps. 1M+ rare cases checked. The root cause, not the label. Private.
And it shifts depending on who built it. Reference ranges are specific to the lab, the machine, and often the population sampled, which is why MedlinePlus advises reading your result against the range printed on your own lab report rather than one you found elsewhere. The same blood, sent to two labs, can come back "normal" in one and "flagged" in the other. The word on the page is a boundary, not a fact about your body.
In-range is not the same as fine
"Normal" and "optimal" are different questions, and the reference range only answers the first one.
Take TSH, the thyroid signal. The American Thyroid Association puts the common range near 0.4 to 4.0, but where the top should sit is genuinely debated. Some researchers argue the upper end is inflated by people with quiet, undiagnosed thyroid trouble, and that many who sit in the upper half of "normal" carry the same fatigue and fog as those flagged as high. This is an open argument, not a settled cutoff. The point is not a magic number. The point is that "in range" and "where you personally feel well" are not automatically the same place.
Ferritin, your iron store, tells the same story. Guidelines flag deficiency around 30, yet symptoms like exhaustion, hair loss, and restless legs commonly appear when ferritin drifts below 30 to 50, and the right threshold shifts with age and inflammation. Where the line belongs is still debated among experts. So a ferritin sitting just above the flag can be "normal" on paper and still be the reason someone is dragging through every afternoon. That gap between normal and optimal is a conversation to have with a clinician, not a number to self-prescribe.
One value is a snapshot, your trend is the story
A single result is a photograph. Your health is a film.
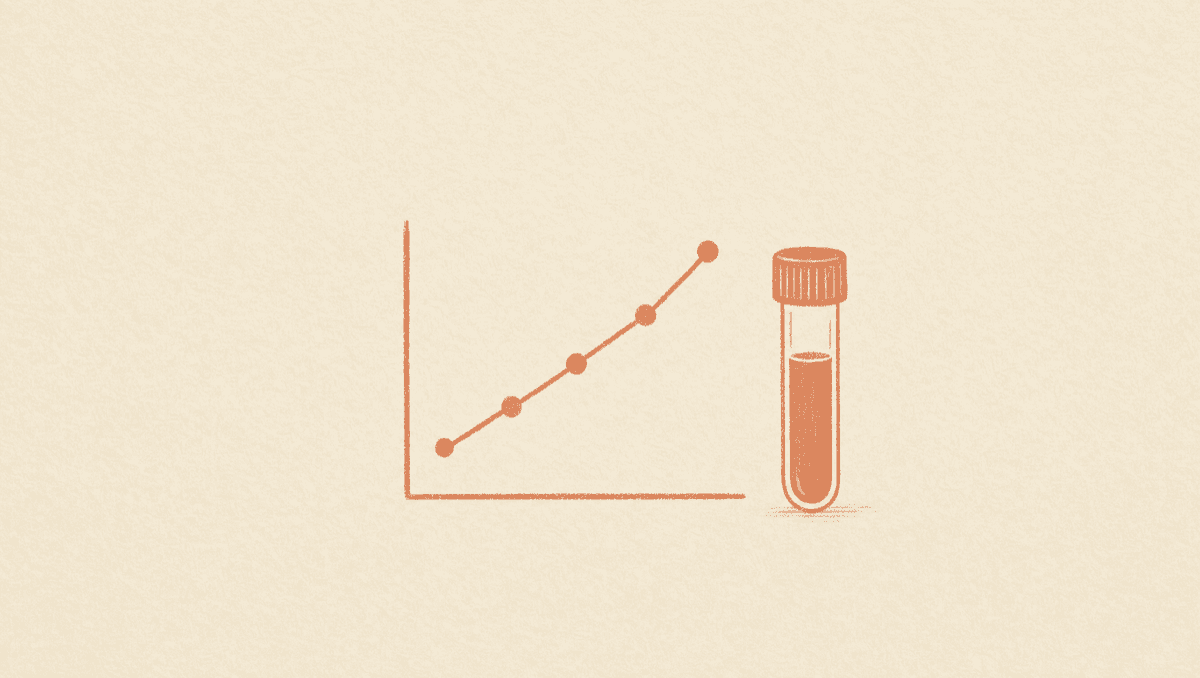
The most useful signal in a blood test is often not whether a value is in or out today, but which direction it has been moving across your own past results. Labs even have a formal tool for this, the reference change value, which asks whether a shift between two of your readings is bigger than normal biological noise. A number can climb steadily, year over year, and stay technically "normal" the entire way up while telling a clear story about where you are heading. One reading cannot show that. Two can start to. A tracked timeline can show it plainly.
This is why one flagged or quietly drifting value is a thread worth pulling, not a box to tick and forget:
- A marker that trends the wrong way while staying "normal." A ferritin sliding down or an LDH creeping up, year after year, is a signal even before it crosses a line.
- A single flagged value with a symptom attached. A borderline thyroid number next to real fatigue deserves a second look, not a shrug.
- A result that sits near the edge and stays there. Persistently bottom-of-range is not the same as comfortably mid-range.
- A "normal" that does not match how you feel. When the paper and the person disagree, the question stays open.
Any one of these is a reason to ask what the trend means and what would explain it, ideally with the earlier results in hand.
How Healz reads past "normal"
This is exactly where a single tired glance at one lab report falls short. Healz puts the whole job in one place: one chat, not ten apps stitched together. Frontier AI runs on your case, and memory is what makes it read past "normal."
Memory holds your prior results. It reads today's value against your own history and trend, so a number still inside the reference range but drifting the wrong way, a ferritin or a TSH sliding year over year, does not slip by unnoticed. That is the change a single snapshot hides.
Root-cause technology takes it further. A "normal" that does not fit your symptoms becomes a question, not a full stop. It cross-checks your case against 1M+ others to find what the label skipped. This is the blood test ai analyzer working the way it should: value against history, symptom against result, drift against baseline.
When you want expert eyes on it, you can bring a board-certified doctor into the same chat for a second opinion.
Five ways to read your own results honestly
- Ask what the range is measuring. "Is this optimal for me, or just inside a population average?" is a fair question for any flagged or borderline value.
- Keep your results in one timeline. Dates, values, and how you felt, together. This is how people who track their own health across years stay ahead of their own care.
- Watch the direction, not just the day. A value moving steadily toward a limit matters, even while it is still "normal."
- Pair the number with the symptom. A borderline result next to a real complaint is a reason to keep looking, not to close the file.
- When "normal" does not match how you feel, get a second read. A result that contradicts your experience is a result worth revisiting with a clinician.
"Normal" was never a statement about you. It is a boundary drawn around a crowd, and in-range is not the same as fine. The fix is structural: read your values as your own trend, pair them with how you feel, and keep the open questions open.
Healz was built to see the whole story, not one line on one day. The wise run Healz.
Frequently asked questions
- What does it mean when my blood test result is "normal"?
"Normal" means your value falls inside the lab's reference range, which is built from the central 95 percent of a presumed-healthy population. It describes where most people land, not what is optimal for you. Because the range is a statistic about a crowd, a result can be "in range" and still not explain how you feel, and a genuinely healthy person can occasionally test outside it.
- Why do reference ranges differ between labs?
Labs use different instruments, methods, reagents, and local reference populations, so each sets its own range. MedlinePlus advises comparing your result only to the range printed on the report from the lab that ran the test, not to a range you found elsewhere. The same sample can read "normal" at one lab and "flagged" at another for exactly this reason.
- Can a blood test be "in range" but still be a problem?
Yes. "In range" answers whether you sit inside a population boundary, not whether the value is right for you. TSH and ferritin are common examples: the American Thyroid Association puts the common TSH range near 0.4 to 4.0, yet the upper limit is debated, and ferritin can sit just above the deficiency flag while symptoms like fatigue persist. A value near the edge, or one that clashes with real symptoms, is worth discussing with a clinician.
- Why does the trend of a blood test matter more than one result?
A single result is a snapshot; your own values over time tell the fuller story. A marker can climb steadily year over year and stay technically "normal" the whole way, which one reading cannot show but a tracked timeline can. Labs even use a formal tool, the reference change value, to ask whether a shift between two of your readings is bigger than normal biological variation.
Written by Healz Team · Filed under Health Insights